
Over the summer holidays I'd been pondering how to improve my Mathematics program using inspiration, ideas and resources from Dan Meyer's blog. I wanted to harness the potential of my classroom interactive whiteboard to the engagement and purpose of digital materials presented using some of the effective information design principles that Dan so passionately espouses. My original idea was to break the back of the Year Six Maths curriculum by designing the flipcharts by topic or concept before school started back but having a real holiday break and spending quality family time after a really intense 2007 put paid to that ambition. Instead, I've made a conscious effort so far this year to stick to my concept and while what I've produced so far could always improve in quality, I reckon I'm on the right track.
I'm not naturally well organised so establishing some base concepts early on has been helpful. I created some template flipcharts using a colour code system to identify the strand. (e.g. Green gradient background = Measurement, Yellow gradient background = Number although the cruddy Toshiba projector I have in my classroom turns that into a dirty lime.) From there I have been seeking out maths related Flickr cc images to hook the kids' interest, get the class thinking and then I try to clearly introduce the concept, process or skill using clear good sized fonts (Tahoma is my favourite) and minimal word based instruction. I'm scouring del.ici.ous links for useful web based simulations, games and embedding them in the flipcharts so that they can become an integral part of the lesson.
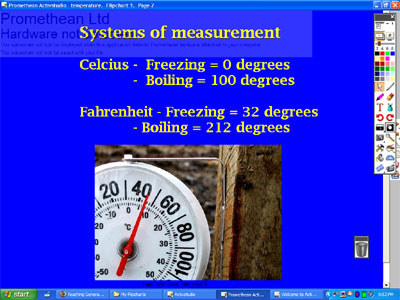
So, I've gone from a wild variety of fonts, backgrounds and amount of mathematical information:

To something that is starting to be more about the maths concept and how the kids will learn that than how it's all going to look.


I've also taken Dan's ideas about effective worksheet design on board as well, designing my own worksheets instead of pulling stuff out of textbooks (where time allows) and even when I do use something that someone else has used, it has at least been with a critical eye and conscience.
Just having a plan of attack is doing wonders for an area of the curriculum I have less than progressive in over the last couple of years. My co-teacher and I reckon our classes are up for the Feltron Project next - modified for 10/11 year olds, of course.
And using this approach is turning up some digital gems. Last night, I started hunting down supporting material for the topic of timelines, starting with units of time measurement, moving to sequence of events in varying time frames and then adding some scale to those timelines. For starters, this time keeping page was an ideal starting point (until the data projector froze this morning and I had to do some fast paddling to get the laptops out, logged on and kids directed to the right spot in cyberspace - a non-digital plan can be a helpful back-up) followed by this great timeline of events based around the fatal tiger attack at the San Francisco Zoo. Tomorrow, I will get them analysing a day of their own life using the ReadWriteThink timeline tool before we look at how to introduce scale into the concept.
Still not sure how to use this timeline on the history of McDonald's in my class but the tool that creates it , xtimeline oozes potential for older users.